
Mihai Postelnicu
Designer & Developer

Making data make sense.
I design and build the interfaces people use to read their data. My work spans visual direction, UI/UX and frontend development, so a dashboard looks clear and stays fast once it is live.
I care about the details that make reporting easy to trust: a layout that puts the important number first, labels that need no explanation, and pages that load quickly on any device. From the first call to handover, I keep the work simple to understand and simple to maintain.
Outside client work, I keep learning how people actually read reports. I test layouts on real screens, watch where readers hesitate, and refine the small interactions, like filters, tooltips and empty states, until the next step always feels obvious.
Articles by Mihai
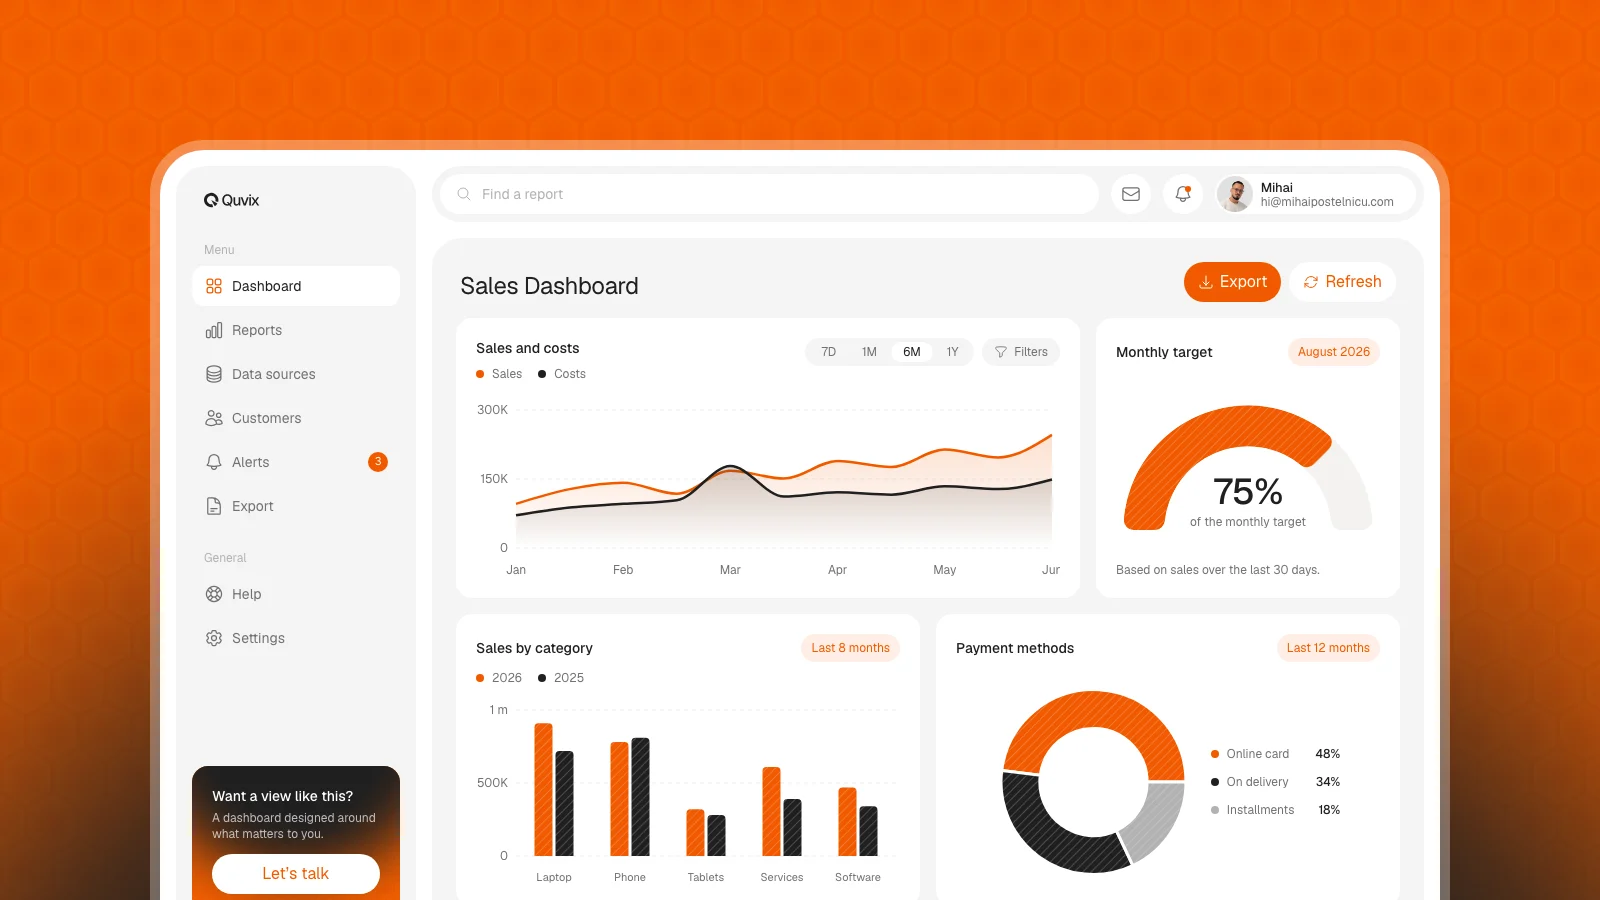 Mihai P.
Start with a decision, then a dashboard
Turn a business question into a focused reporting product by defining the decision, choosing metrics, and testing real tasks.
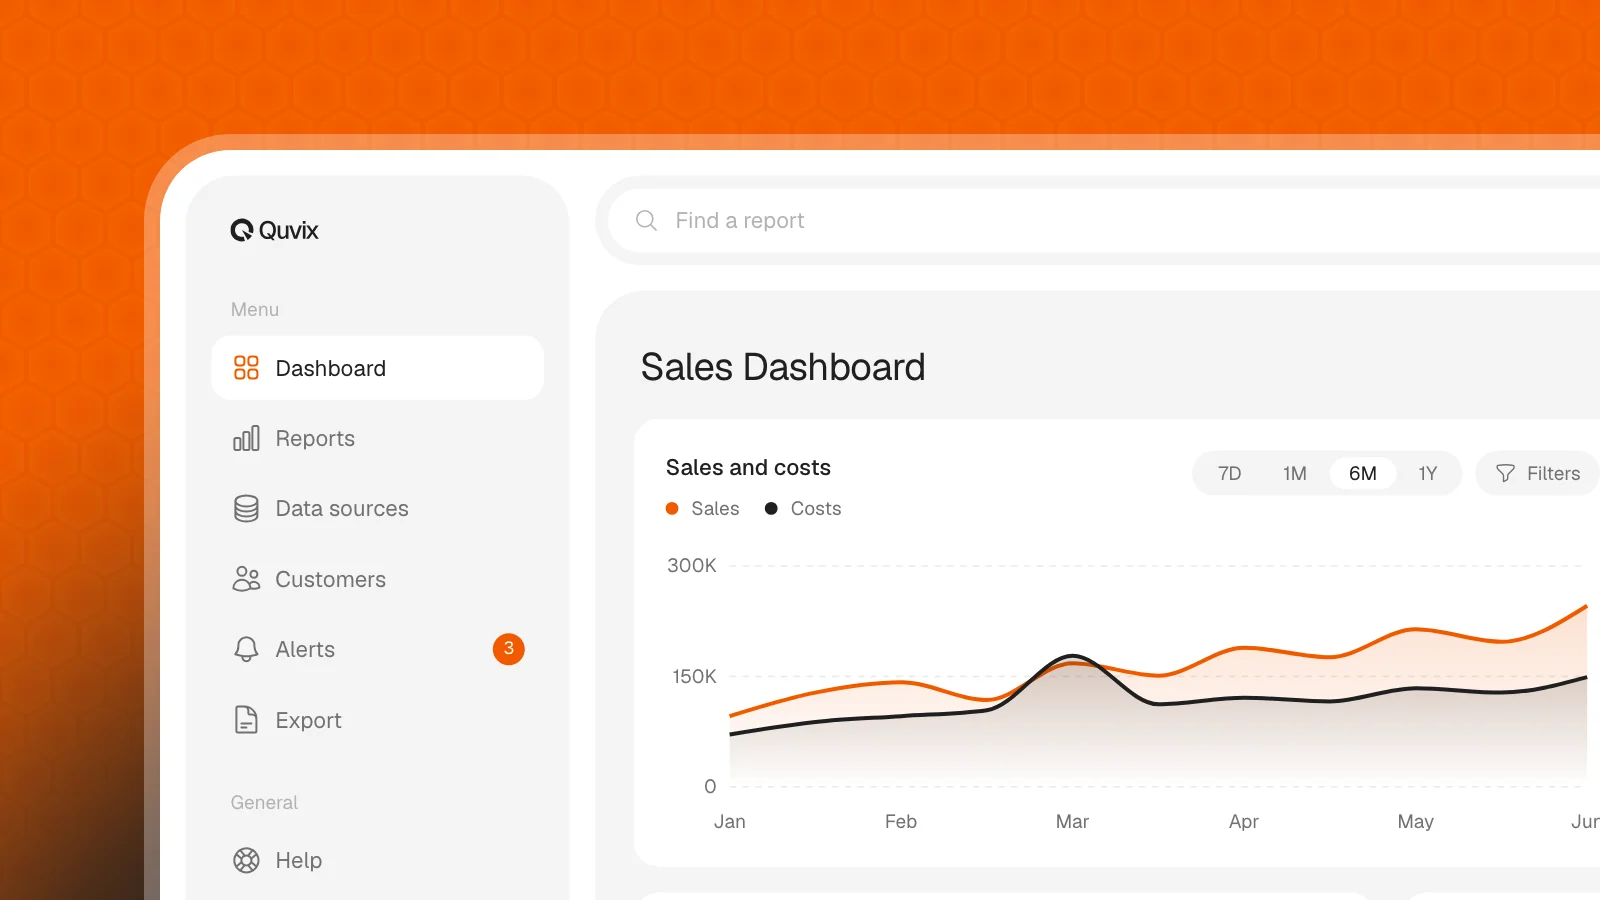 Mihai P.
Design dashboards for everyday decisions
Make reports easier to use with clear labels, helpful defaults, and accessible interactions for everyday business decisions.
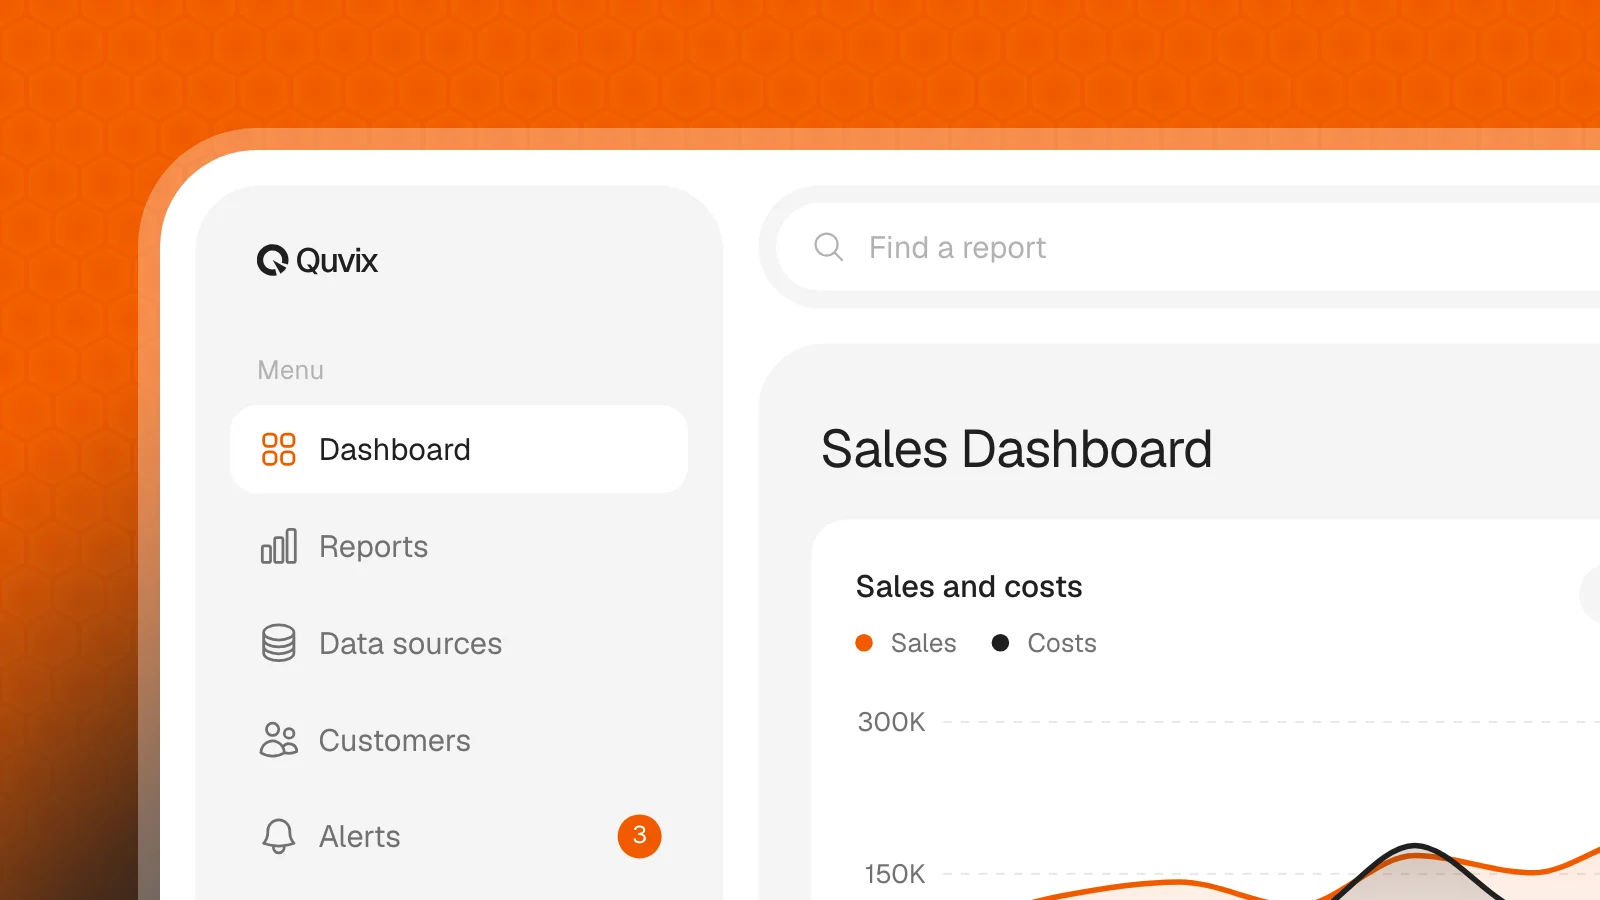 Mihai P.
A handover that helps your reports stick
Help your team build lasting reporting habits with practical training, useful examples, and clear support after handover.
The data is there.
Let’s make sense of it.
We’ll review what you already have and show you what your data can reveal. Your first call is free.
 Let’s talk