
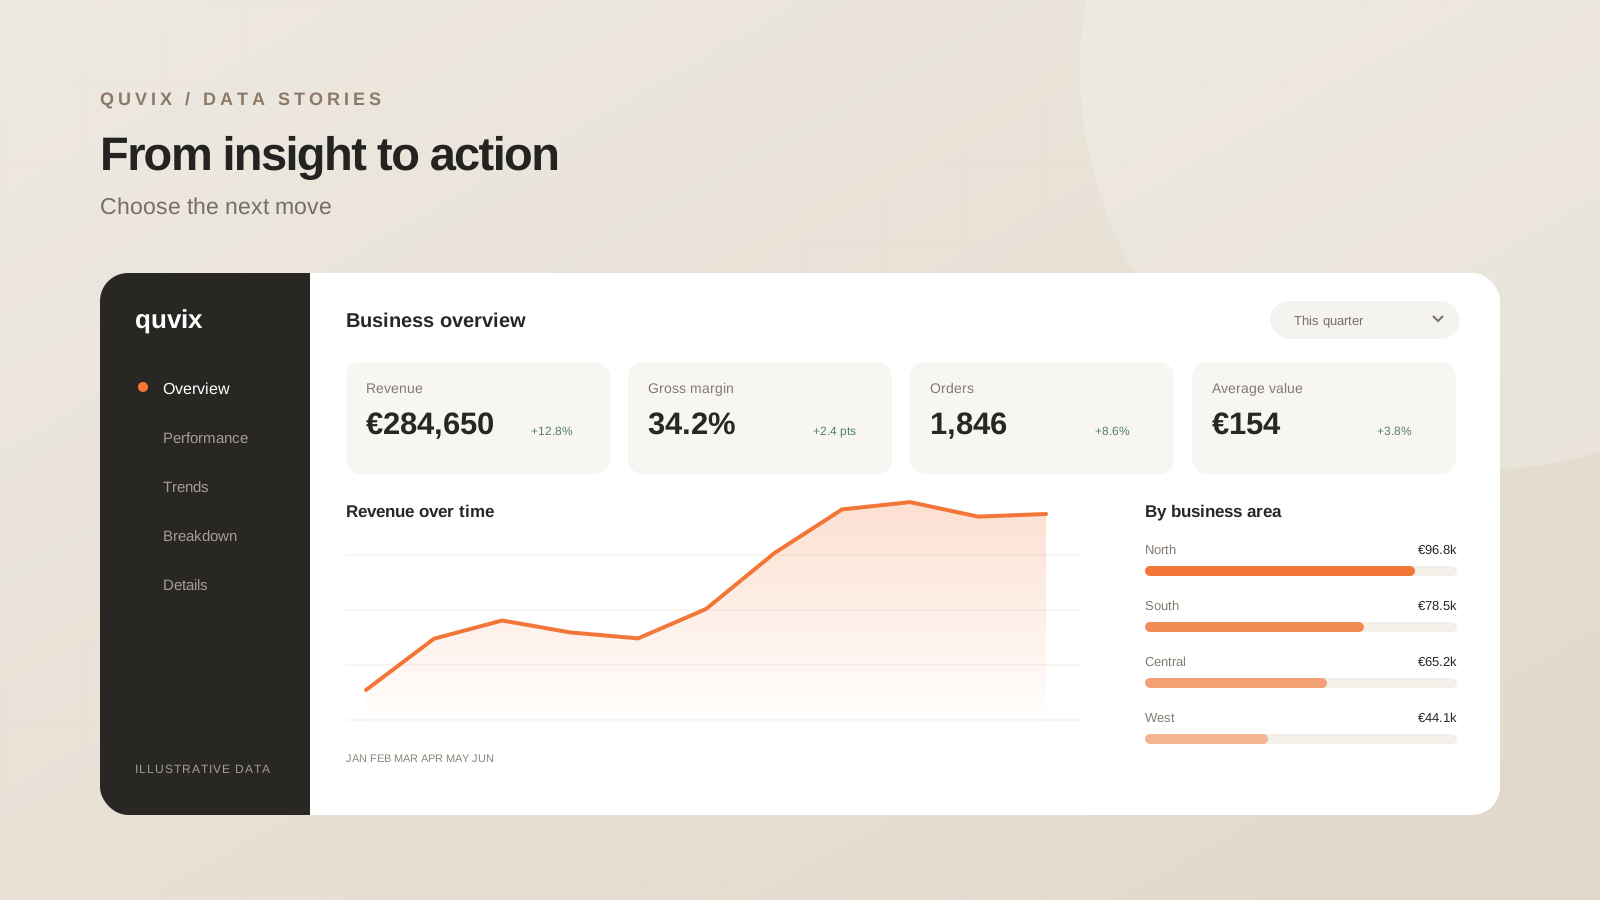
Turn a business question into a focused reporting product by defining the decision, choosing metrics, and testing real tasks.
 ChatGPT
 Claude
 Google
 Grok
The question before the chart
A dashboard can contain accurate numbers and still leave its reader unsure what to do. That usually happens when the design begins with the available data rather than the decision it should support. Before choosing a visual, complete this sentence: “When this changes, we will decide whether to…”
For a sales manager, the decision might be where to focus next week’s account reviews. For an operations team, it might be which orders need attention today. Those are different jobs, even if both teams look at revenue.
Give every metric a purpose
Write a short definition for each proposed measure. Include its owner, its time window, and the action it can inform. If nobody can explain what would change after seeing it, the metric probably belongs on a supporting page.
| Question | Useful measure | Next action |
|---|---|---|
| Are we on track? | Revenue against an agreed target | Review the gap |
| Where is the change? | Contribution by region | Prioritise a region |
| What needs attention? | Accounts with declining orders | Arrange account reviews |
The purpose of this exercise is focus. Five measures with clear relationships are more useful than twenty disconnected cards. Supporting detail can remain accessible through filters and drill-through pages.
Design a reading order
Start with the outcome, explain the drivers, then offer the detail. This gives the page a natural sequence: what happened, why it happened, and where to investigate. Use consistent number formats and leave enough space between groups for the relationships to remain obvious.
A good first review takes place without a presentation. Ask a colleague to describe the page in their own words. If they need you to explain the meaning of every visual, revise the labels and hierarchy before adding more functionality.
Test the next decision
Use a realistic scenario rather than a general request for feedback. Ask someone to identify a region that needs attention and explain the evidence. Notice which filters they use, where they hesitate, and whether they can repeat the task.
The dashboard is ready when the reader can make the intended decision with confidence. A beautiful layout supports that outcome; it cannot replace it.
Share this article: